


Most help desk capacity planning advice comes from enterprise contact centers running 500+ agents across multiple sites. They'll tell you to implement Verint or NICE, build statistical forecasting models, and hire a dedicated workforce management analyst. That's like telling someone who needs to cross a stream to build the Golden Gate Bridge.
Small help desks need something different. After helping dozens of support teams get through capacity crunches without million-dollar WFM platforms, the same lightweight approach works repeatedly: a basic demand model you can build in spreadsheets, a shift-supply map that shows actual coverage, seasonal adjustments based on your own patterns, and surge routing rules that don't require complex software.
The gap between what small teams need and what the industry pushes is real. Enterprise WFM tools assume you have dedicated analysts, years of clean historical data, and agents on fixed schedules. Meanwhile, your team of 12 agents handles everything from password resets to billing escalations, half work part-time, and your "historical data" is whatever your ticketing system can export to CSV.
Why Traditional Capacity Models Break for Small Teams
Traditional help desk capacity planning relies on Erlang C calculations, service level targets, and shrinkage assumptions that make sense when you're scheduling 200 agents. At that scale, statistical averaging works. Individual variations smooth out. Complex models produce useful predictions.
Watch what happens when a 15-agent help desk tries to use enterprise forecasting methods. The models assume consistent arrival patterns, but your Monday morning volume is 3x your Thursday afternoon. They calculate to decimal precision, suggesting you need 4.7 agents at 2pm — when you can only schedule whole humans. They treat all work as interchangeable, missing that only three agents know your enterprise product while everyone can handle basic tickets.
The breaking point usually comes during seasonal peaks. Enterprise models tell you to staff up 30% for the holiday season. Great advice if you can pull trained agents from other departments or hire temps through an outsourcer. Less helpful when your hiring process takes six weeks and new agents need a month of training before they're genuinely productive.
What small teams actually deal with: tickets bunch up unpredictably, agents wear multiple hats, and one person calling in sick can blow up your entire day's coverage. Standard WFM math doesn't account for Sarah being the only one who handles Spanish tickets, or Mike covering both phone and chat because he types fastest.
Building Your Demand Model Without Statistical Complexity
Forget trying to predict exact ticket arrivals by half-hour intervals. Small help desks need a demand model that captures patterns without drowning in precision.
Never lose track of a customer request again.
Servyly helps you track, assign, and resolve every ticket quickly and efficiently.
- Centralized ticket management
- Automated response workflows
- Team collaboration tools
No credit card required
Start with weekly patterns, not daily. Export your last 8–12 weeks of ticket data and look for the rhythm. Most small help desks see something like: Monday surge from weekend accumulation, steady Tuesday through Thursday, Friday afternoon drop-off. Don't average these into a smooth line — keep the peaks and valleys visible.
Your demand model needs three core components: baseline volume, day-of-week multipliers, and hour-of-day distribution. Baseline is your typical Tuesday afternoon — the neutral state. Multipliers show how each day compares: Monday might be 1.4x baseline, Friday 0.8x. Hour distribution shows when tickets arrive within each day type.
Here's what this looks like practically:
| Time Block | Monday | Tue–Thu | Friday |
|---|---|---|---|
| 8am–10am | 35% of daily | 20% of daily | 25% of daily |
| 10am–12pm | 25% of daily | 30% of daily | 35% of daily |
| 12pm–2pm | 15% of daily | 25% of daily | 20% of daily |
| 2pm–4pm | 15% of daily | 15% of daily | 15% of daily |
| 4pm–6pm | 10% of daily | 10% of daily | 5% of daily |
That Monday morning crunch — 35% of tickets before 10am — isn't a statistical anomaly, it's your reality. Weekend issues pile up, customers catch up on admin tasks, and your team gets hammered before lunch.
Track ticket count and handle time separately. A password reset takes 3 minutes, a billing dispute takes 20. If your mix shifts toward complex tickets, raw ticket count becomes meaningless for capacity planning. Keep a simple categorization: quick (under 5 min), standard (5–15 min), complex (15+ min).
Keep a separate column for ticket complexity so you can weight workload by handle time.
Some teams try to get fancy with regression analysis or time series forecasting. Unless you have someone who genuinely understands statistics, stick with rolling averages and visible patterns. A simple model you understand beats a complex one that's a black box.
Mapping Shift Supply to Actual Coverage
The shift-supply map shows what coverage you actually have versus what the schedule claims. This gap is where small help desks quietly fall apart.
Your schedule might show 5 agents from 10am–2pm. But Jennifer takes lunch at noon, David has a standing 11am training session on Wednesdays, and Carlos covers Spanish overflow from another team between 11–12. Your actual coverage is closer to 3.5 agents, with gaps nobody planned for.
Build your shift-supply map in layers:
Layer 1: Scheduled shifts Plot when each agent is supposed to be working. Include part-timers, split shifts, and that odd arrangement where someone works 7am–11am then 2pm–4pm because of childcare.
Layer 2: Planned reductions Subtract breaks, lunch, training, one-on-ones, team meetings. Be realistic — that "15-minute standup" takes 25 minutes once you account for getting everyone together and the post-meeting chatter.
Layer 3: Channel and skill constraints Note who can handle what. If only certain agents handle phone, your phone coverage looks different from your ticket coverage. Same for language skills, product expertise, or escalation authority.
Layer 4: Productivity variance New agents work slower. Senior agents handle complex issues. That one superstar closes tickets at twice the average rate. Don't pretend everyone produces equally.
The result shows your true capacity curve throughout the day. You'll spot problems invisible on the regular schedule: a 30-minute window where phone coverage drops to one person, an afternoon block where all your senior agents are in meetings, a Friday gap when part-timers have left but the evening shift hasn't arrived.
Most small teams discover they're trying to maintain 8-hour coverage windows with maybe 6 hours of actual usable capacity. No wonder everything feels stretched.
Seasonal Adjustments Without Years of Historical Data
Enterprise WFM relies on multiple years of seasonal data to predict patterns. Small help desks rarely have clean historical data, and even when they do, the business has often changed enough that old patterns don't really apply anymore.
Instead of statistical seasonal modeling, use event-based adjustments. Track what actually drives your volume changes: product launches, billing cycles, academic calendars, industry events, marketing campaigns.
Build a simple seasonal factor table:
| Period | Factor | Driver |
|---|---|---|
| First week of month | 1.3x | Billing questions |
| Last week of quarter | 1.2x | Renewal processing |
| Week after product update | 1.5x | Feature questions |
| School breaks | 0.7x | B2B customers away |
| Black Friday week | 2.1x | Promotional issues |
Don't try to blend multiple factors into complex calculations. If it's both the first week of the month and post-product launch, use the higher factor. Precision doesn't matter as much as having reasonable estimates you can actually act on.
Watch for seasonal patterns unique to your business. A help desk supporting accounting software sees tax season spikes. One supporting outdoor equipment sees weather-driven patterns. Education technology follows school calendars. These are more reliable than generic "Q4 is busy" assumptions.
Keep adjustment rules simple. If your baseline Tuesday is 50 tickets and next Tuesday is the first week of the month, expect around 65. That's enough precision for scheduling decisions.
December is a good example of why smooth seasonal curves fail small teams. It's not uniformly busy — it's dead during the holiday week but slammed right before it, when everyone's scrambling to wrap up year-end tasks. Specific events drive your patterns, not calendar quarters.
The Surge Routing Playbook
When volume spikes hit, small help desks can't just "add more agents" the way enterprise call centers do. You need routing rules that squeeze more out of existing capacity without requiring complex orchestration.
The surge routing playbook isn't about fancy skills-based routing or AI-powered distribution. It's about clear rules for who handles what when things get messy.
Below is how a tiered routing structure typically works in practice:
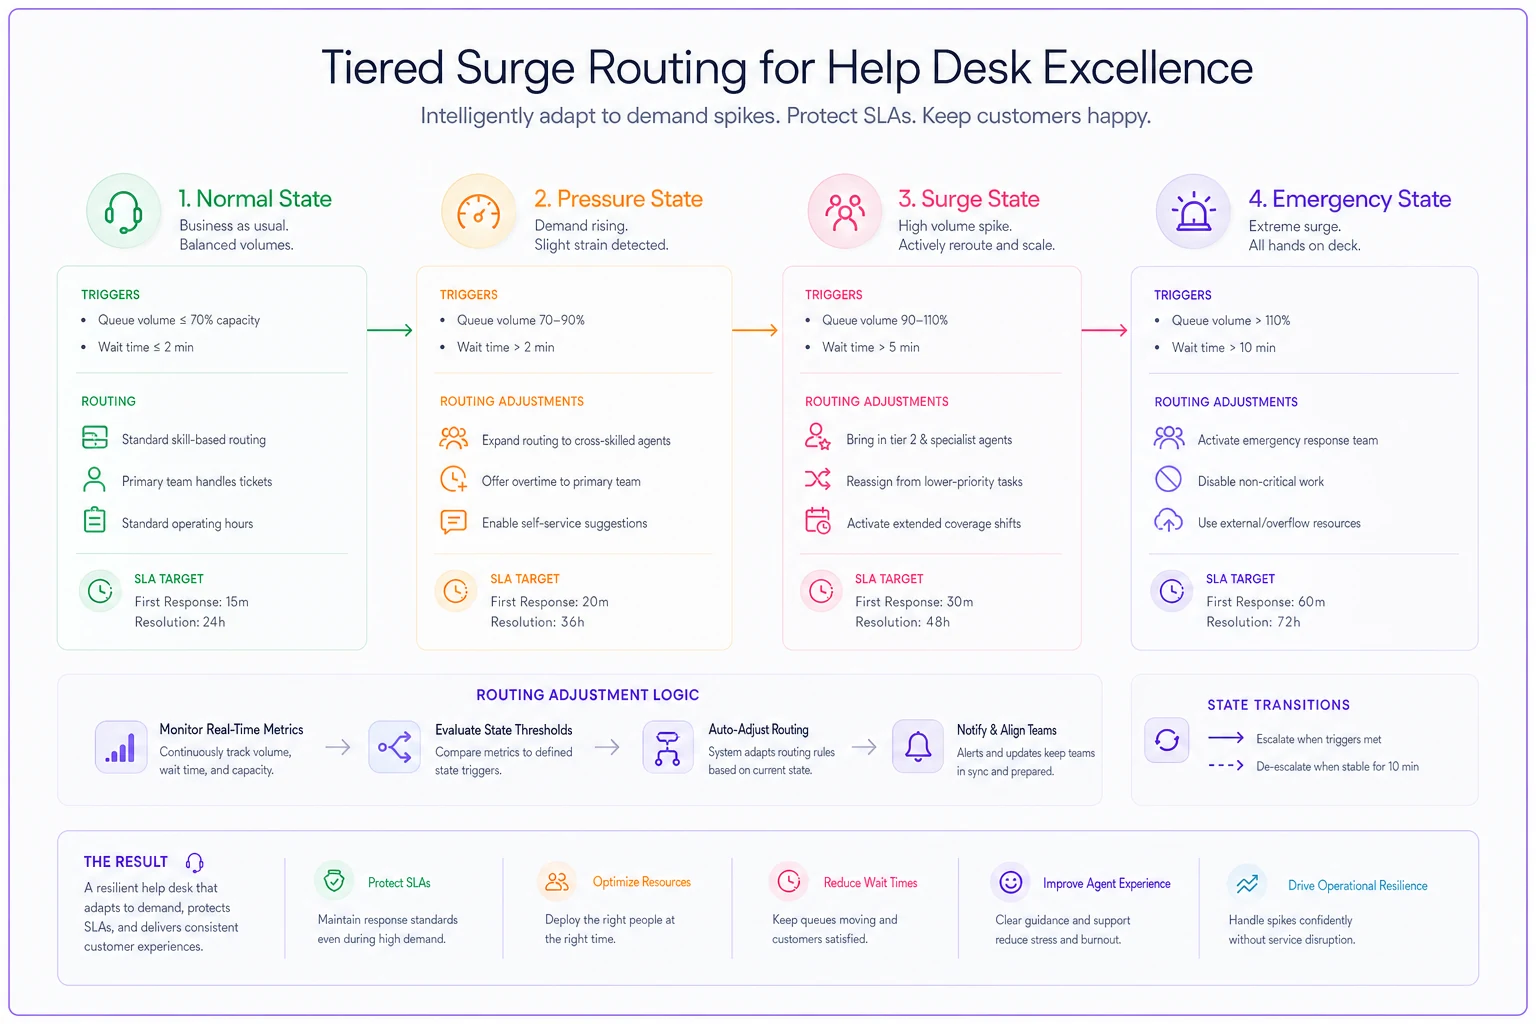
This diagram shows tier triggers and routing adjustments across the states.
Normal State → Pressure State (20% over capacity) → Surge State (40% over) → Emergency State (60%+ over) Each tier: trigger condition → routing adjustments → SLA changes
Tier 1: Normal state routing Your standard rules. Tickets flow to primary queues, specialists handle their areas, normal SLAs apply.
Tier 2: Pressure state routing (20% over capacity) First escalation tier. Non-urgent tickets get delayed responses, everyone handles one level below their usual complexity, chat agents pick up email overflow. SLAs extend by 50% for non-critical issues.
-
Senior agents stop taking training tickets, focus on complex issues
-
Part-time agents extend by 30 minutes if possible
-
Automated responses acknowledge receipt and set expectations
-
Internal requests move to next-day queue
Tier 3: Surge state routing (40% over capacity) Real crisis mode. All hands on deck, specialty routing suspended except for critical skills, management takes tickets.
-
All agents handle all ticket types they're capable of
-
Phone-only agents start taking chats
-
Lunch breaks stagger to maintain coverage
-
Auto-close triggers fire for resolved-but-unclosed tickets
-
Templates become mandatory for common issues
Tier 4: Emergency state routing (60%+ over capacity) System preservation mode. Some channels close, some ticket types get deferred, the focus shifts to preventing cascade failure.
-
Chat channel closes to new sessions
-
Phone IVR states extended wait times
-
Email auto-response states 48-hour delays
-
Only critical issues get immediate attention
-
All meetings cancelled except crisis coordination
Each tier needs clear triggers — not subjective judgments about whether things "feel busy." Use specific metrics: queue depth exceeds X, average wait time exceeds Y, available agent count drops below Z.
Write the actual routing logic in plain language anyone can execute:
"When queue depth exceeds 30 tickets AND wait time exceeds 15 minutes: Sarah stops Spanish-only queue, joins general pool. Mike covers Sarah's Spanish overflow. Alex postpones training tickets until next day."
This beats complex routing algorithms because your team can understand and execute it immediately, without waiting for IT to reconfigure anything. When you're in the middle of a spike, clear written rules are worth more than sophisticated systems nobody can navigate under pressure.
Preventing Full WFM Implementation Traps
The worst mistake small help desks make is buying enterprise WFM software hoping it will solve capacity problems. These platforms require more setup, maintenance, and expertise than most small teams actually have.
Common WFM implementation traps:
The data requirement trap: Enterprise WFM needs 6–12 months of clean historical data. Your ticketing system has gaps, miscategorized tickets, and maybe that three-week stretch where timestamps were broken because of a timezone bug.
The configuration complexity trap: Setting up skills, service goals, shrinkage assumptions, and forecasting parameters requires expertise you probably don't have in-house. Default settings won't match your reality. You end up with expensive software producing useless schedules.
The flexibility limitation trap: WFM software assumes agents work consistent schedules. Your team includes parents with variable availability, students with changing class schedules, and that one person who only works Tuesday/Thursday but stays late.
The integration overhead trap: Full WFM platforms need to connect with your ticketing system, phone platform, chat tool, scheduling system, and HR database. Each integration breaks occasionally. You spend more time maintaining connections than actually planning capacity.
Instead of full WFM implementation, build modular capabilities:
Use spreadsheets for demand modeling — they're flexible and everyone understands them. Track shift supply in whatever scheduling tool you already use, even Google Calendar works. Document routing rules in a simple wiki or shared doc. Run capacity reviews in your existing meetings instead of adding WFM-specific sessions.
Operational discipline matters more than the tools. A well-run manual process beats badly-implemented automation. Small teams that skip straight to enterprise tools usually end up with expensive software they barely use while still struggling with the same capacity problems.
When Temporary Routing Rules Become Permanent Problems
Every surge routing rule starts as temporary. "Just for this week while we're short-staffed." Six months later, you're still running in Tier 2 pressure state and wondering why agent burnout is climbing.
The danger isn't surge routing itself — it's when exceptional measures quietly become standard operations. Your team adapts to crisis mode. Quality drops but gets normalized. Agents who were stretching temporarily start breaking permanently.
Warning signs you've normalized surge state:
-
"Temporary" routing rules have been active for over a month
-
Agents can't remember normal state procedures
-
Every week has some reason to stay in pressure mode
-
SLA exceptions have become the actual SLA standards
-
You're hiring to staff for surge volume, not baseline
One help desk ran surge routing for three straight months during a product migration. By the end, roughly half the agents had quit, quality scores had tanked, and customers were creating duplicate tickets because they assumed the first one was lost. The "temporary" fix had broken the entire operation.
Breaking the surge cycle takes deliberate action.
First, calculate the real cost of permanent surge mode. Include agent turnover, training costs, quality issues, and customer churn. Compare this to the cost of proper staffing. The math usually favors fixing the underlying capacity problem.
Second, set hard limits on surge duration. After two weeks in pressure state, something has to change: defer non-critical work, adjust SLAs officially, or add temporary capacity. Don't let crisis mode become comfort mode.
Third, build recovery time into your planning. After a surge event, schedule lighter days for recovery. Agents need time to catch up on training, documentation, and mental reset. Running straight from one surge into another is a reliable path to team breakdown.
Making Capacity Decisions with Incomplete Data
Small help desks never have perfect data for capacity planning. You're making decisions based on partial information, inconsistent patterns, and shifting requirements.
The key is knowing which data actually matters and which precision you can afford to sacrifice.
Essential data you actually need:
-
Average daily ticket volume by day of week
-
Rough handle time by ticket type
-
Agent availability by shift
-
Core coverage requirements (channels, languages, etc.)
Nice-to-have data that isn't essential:
-
Precise arrival patterns by 30-minute intervals
-
Individual agent productivity metrics
-
Detailed shrinkage calculations
-
Multi-year seasonal patterns
Make decisions with confidence intervals, not false precision. Instead of "we need exactly 4.3 agents at 2pm," think "we need 4–5 agents mid-afternoon." Instead of "Tuesday volume is 247 tickets," think "Tuesday typically runs 230–260 tickets."
Build buffers into your planning. If the math says you need 10 agents and you have exactly 10, you're already understaffed. Someone will call in sick, tickets will spike, or a complex issue will eat two hours of someone's day. Plan for a 15–20% buffer on critical coverage periods.
Test capacity decisions quickly and adjust. Don't wait three months to see if your new shift pattern is working. Check weekly: Are queues building? Are agents stressed? Are SLAs holding? Quick adjustments beat perfect planning every time.
Document the assumptions behind capacity decisions. When you reduced Friday afternoon coverage, what data supported that call? When volume patterns change, you'll know exactly which decisions need revisiting.
The Real Economics of Proper Capacity Planning
The business case for proper help desk capacity planning isn't about efficiency metrics or utilization rates. It's about avoiding the hidden costs of running understaffed.
Agent turnover cost: Constantly running in surge mode burns out agents. If poor capacity planning increases turnover by just 20%, and replacing an agent costs somewhere around $5,000 in recruiting, training, and ramp time, a 15-agent team is losing roughly $15,000 annually just on excess turnover.
Quality degradation cost: Rushed agents make more mistakes. If capacity pressure increases error rates by 10%, and each error costs around $50 to fix — including customer appeasement, rework, and escalation time — that's thousands in preventable costs every year.
Customer lifetime value impact: Customers who experience consistent delays and poor service churn faster. If poor capacity planning increases churn by even 2%, the revenue impact easily dwarfs any savings from running lean.
Opportunity cost: Agents stuck in permanent surge mode can't improve processes, build documentation, or handle proactive outreach. The improvements that never happen because everyone's always drowning might be your biggest loss.
Compare this to the cost of proper capacity planning: some spreadsheet time, clear documentation, maybe an extra part-time agent for coverage. The ROI becomes obvious once you count real costs, not just salary line items.
Building Your Lightweight Capacity Planning System
Start with the basics and add complexity only when you actually need it. Here's a practical implementation timeline:
-
Week 1–2
Baseline data gathering - Export last 8 weeks of ticket data - Map current shift schedules - Document who handles what (skills, languages, products) - Identify your busiest and slowest periods
-
Week 3–4
Build simple models - Create day-of-week volume patterns - Calculate average handle times by ticket type - Map actual vs. scheduled coverage - Identify obvious gaps
-
Week 5–6
Design routing rules - Define tier triggers (normal, pressure, surge, emergency) - Write specific routing instructions for each tier - Create simple escalation paths - Document everything in a shared location
-
Week 7–8
Test and adjust - Run routing drills during slow periods - Adjust triggers based on reality - Train the team on the rules - Gather feedback and refine
-
Ongoing
Weekly capacity review - Check forecast vs. actual volume - Identify emerging patterns - Adjust next week's schedule - Document lessons learned
The entire system should fit in 3–4 spreadsheets and a few pages of documentation. If it's more complex than that, you're overbuilding for a small team's needs.
Key tools you actually need:
-
Spreadsheet for demand modeling (Google Sheets works fine)
-
Scheduling tool agents can access remotely
-
Shared document for routing rules
-
Weekly review template
-
Basic dashboard showing queue status
Tools you don't need yet:
-
Statistical forecasting software
-
Automated schedule optimization
-
Real-time adherence tracking
-
Complex skills-based routing engines
-
Expensive WFM platforms
Getting the basics working well will do more for your team than any sophisticated tool you're not ready to use properly.
Adapting When Business Patterns Shift
Your carefully built capacity model will break when business patterns change. New product launches, market shifts, competitive changes, and unexpected events all disrupt historical patterns. Small help desks need to adapt quickly without rebuilding everything from scratch.
Watch for leading indicators that patterns are shifting:
-
Marketing mentions upcoming campaigns
-
Product team schedules major updates
-
Sales reports pipeline changes
-
Customer success flags account issues
-
Social media shows a problem brewing
When patterns shift, don't immediately abandon your model. First, figure out whether this is temporary or permanent. A one-week spike from a viral social post is temporary. A new enterprise customer doubling your ticket base is permanent.
For temporary shifts, use surge routing and document the impact. Over time you'll build a useful library of adjustment factors: "viral social mention = roughly 3x normal volume for 72 hours" or "major outage = 5x volume day-of, 2x the next day, back to normal by day three."
For permanent shifts, rebuild incrementally. Don't throw out everything and start over. Adjust your baseline volumes, add new routing rules for new ticket types, extend coverage hours if needed — but keep the framework that's working.
The most successful small help desks treat capacity planning as a living system, not a one-time setup. They review patterns monthly, adjust rules quarterly, and rebuild models annually. That rhythm keeps things current without constant chaos.
Help desk capacity planning doesn't require enterprise WFM tools or statistical modeling expertise. What it requires is understanding your actual patterns, documenting clear rules, and maintaining operational discipline.
The approach outlined here — simple demand model, accurate shift-supply mapping, event-based seasonal adjustments, and tiered surge routing — gives small help desks the capacity planning they actually need. Not perfect predictions, but good enough guidance to avoid constant crisis mode.
This lightweight approach can be implemented immediately with tools you already have. No vendor selection, no integration projects, no training on complex software. Just spreadsheets, clear documentation, and team alignment.
The small help desks that thrive aren't the ones with the most sophisticated forecasting models. They're the ones that understand their real capacity, plan for realistic scenarios, and adjust quickly when reality doesn't match the plan. Build that capability, and you'll handle whatever volume comes your way without drowning in complexity or burning out your team.
Capacity planning for small help desks is about survival and sanity, not optimization and efficiency. Get the basics right, and your team can focus on actually helping customers instead of constantly fighting fires.
Ready to transform your support operations?
Join 500+ support teams using Servyly to reduce resolution times, improve customer satisfaction, and boost team productivity.