



Most support metrics die in the dashboard they're born in. First response time sits on a wallboard. CSAT gets emailed once a week. Backlog gets mentioned in standup. None of it ever makes it into a room where someone with a budget is actually deciding something.
That's the real problem with support measurement. Not that teams don't track enough — most track way too much — but that nothing connects. A support manager can tell you their median handle time to the second and still have no way to answer the question a VP actually asks: "Is support helping us keep customers or not?"
The fix isn't more metrics. It's a hierarchy — a way of stacking what you measure so the day-to-day operational stuff rolls up into commercial language. Leading indicators feed operational health. Operational health feeds business outcomes. Every layer has an owner and a trigger that says "when this moves, do this."
Why support metrics stay stuck at the operational layer
The pattern you see almost everywhere: support teams measure what their tooling makes easy to measure. Help desk platforms ship with response time, resolution time, ticket volume, and CSAT baked in. So those become the metrics. They're operational by nature — they describe how the support machine is running, not what it's producing for the business.
The trouble is those numbers are illegible to anyone outside support. A revenue leader doesn't care that your reopen rate went from 9% to 6%. They care whether the accounts churning last quarter were the same accounts drowning in reopened tickets. That's a real question, and most support orgs genuinely can't answer it because their metrics were never designed to travel upward.
What breaks this is scale. At ten agents and a couple hundred tickets a day, the support manager basically is the dashboard — they feel the churn risk because they've read half the angry tickets themselves. At forty agents across three time zones and four product lines, that intuition disappears. Nobody can hold the whole picture. And if the metrics haven't been structured to reconstruct it, leadership starts flying blind exactly when the stakes are highest.
The other failure is subtler. Teams do try to report to the business, but they report raw operational data dressed up as insight. "We handled 12,400 tickets this month, up 8%." Okay — is that good? Bad? Does it mean the product is getting worse or the customer base is growing? Volume without context is noise. It fills a slide and answers nothing.
The three tiers, and what actually belongs in each
Think of it as three layers, each answering a different question for a different audience.
Never lose track of a customer request again.
Servyly helps you track, assign, and resolve every ticket quickly and efficiently.
- Centralized ticket management
- Automated response workflows
- Team collaboration tools
No credit card required
Tier 1 — Leading indicators. These are early-warning signals, mostly owned by team leads and senior agents. They predict problems before those problems show up in outcomes. Things like: contact rate on a newly launched feature, first-week ticket volume from a cohort of new accounts, sentiment drift in a specific product area, or a spike in "how do I" questions that signals an adoption gap. Leading indicators are noisy and directional. You don't report them to the board — you act on them fast.
Tier 2 — Operational health. This is the layer most teams already live in: resolution time, backlog, reopen rate, CSAT, SLA attainment, agent utilization. Owned by support managers. These tell you whether the support function is healthy and where it's straining. They're the bridge — they translate the noise below into stable signals above.
Tier 3 — Business outcomes. Revenue retained, churn attributable to support experience, expansion influenced by support interactions, adoption lift after support-driven education, cost-to-serve by segment. Owned by the support director or VP, spoken in the language of the exec team. This is where support stops being a cost center in the story and starts being a lever.
| Tier | Example metrics | Owner | Question it answers | Reporting cadence |
|---|---|---|---|---|
| Leading | Feature contact rate, cohort first-week volume, sentiment drift, "how-to" query spikes | Team leads | What's about to go wrong? | Daily / real-time |
| Operational | Resolution time, backlog, reopen rate, CSAT, SLA attainment | Support managers | Is the function healthy? | Weekly |
| Business outcome | Churn attributable to support, revenue retained, adoption lift, cost-to-serve | Director / VP | Is support moving the business? | Monthly / quarterly |
The tiers are only useful if you treat them as a connected system, not three separate reporting tracks.
The piece people miss: the tiers aren't just categories, they're a pipeline. Each tier should feed the one above it. A leading indicator that never rolls into an operational metric is just trivia. An operational metric that never connects to a business outcome is internal hygiene and nothing more.
Wiring the tiers together so signals actually travel
A hierarchy on paper does nothing. The value shows up when a Tier 1 blip mechanically connects to a Tier 3 conversation.
Say a new billing feature ships. Within 48 hours, a team lead notices the contact rate on billing questions has jumped — that's the leading signal. On its own, it might just be launch turbulence. But over the next week, that spike shows up in Tier 2 as a rising backlog in the billing queue and a dip in CSAT for accounts that touched the feature. Now it's an operational problem with a shape.
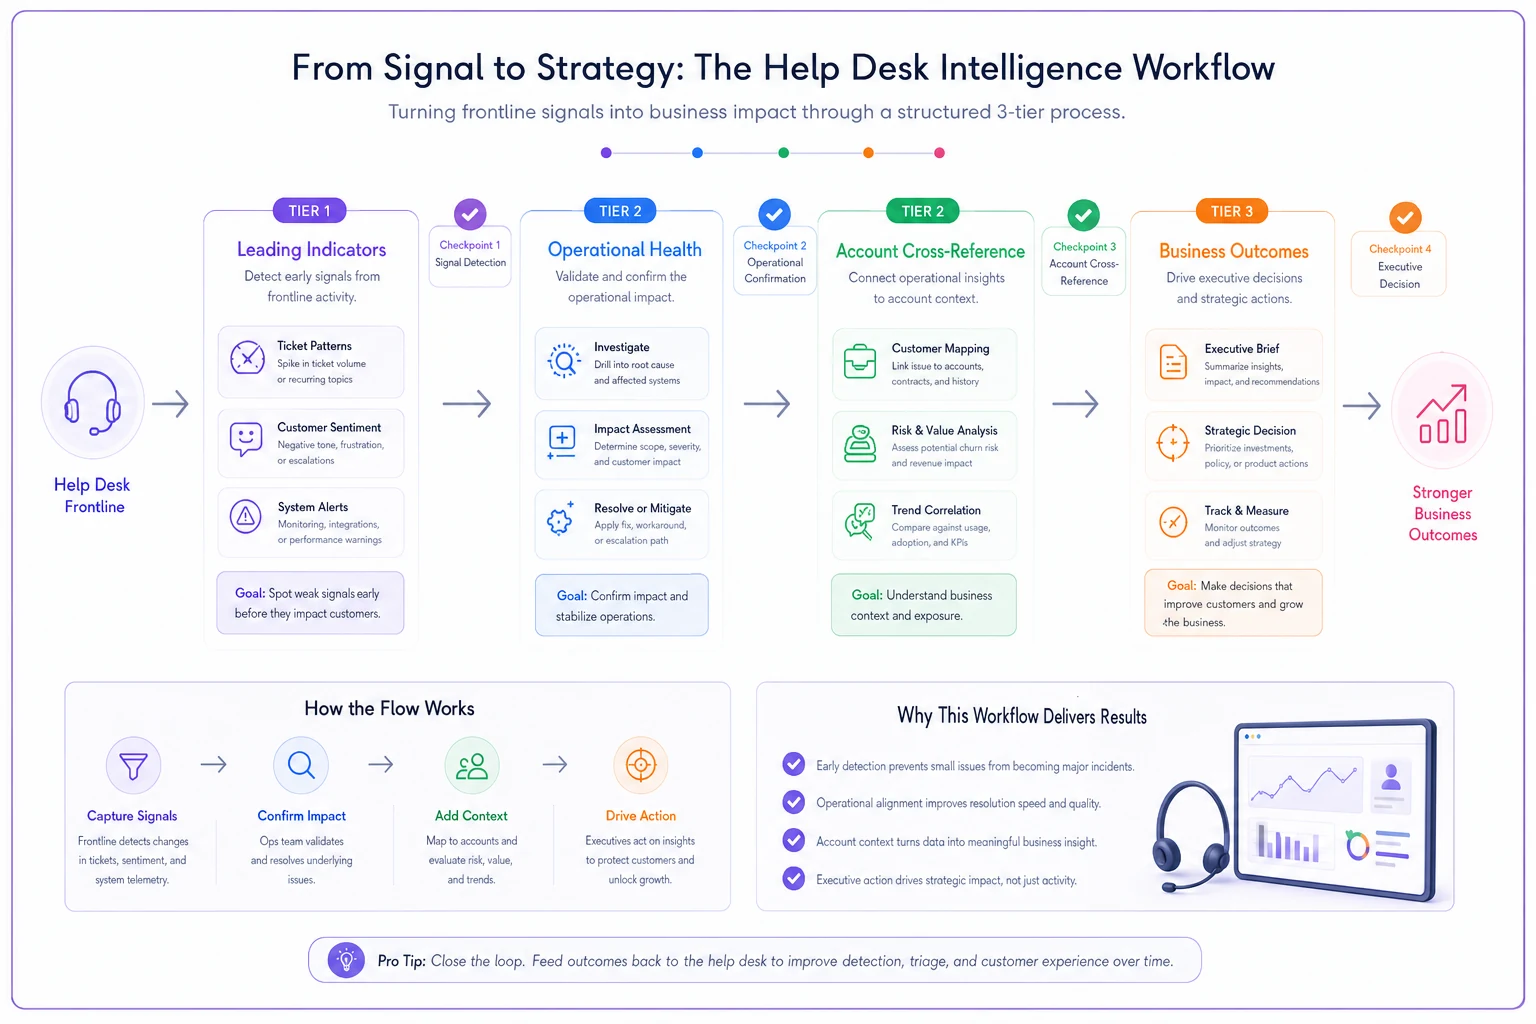
Then someone cross-references those tickets against account data and finds that a disproportionate share came from mid-market accounts up for renewal in the next 90 days. That's the moment it becomes a Tier 3 conversation: a defined slice of at-risk revenue tied to a specific product experience. The support team isn't reporting "billing tickets are up" anymore — they're saying "we have roughly $180k in renewals showing friction on the new billing flow, and here's the fix path."
That whole chain only works if the underlying data is clean and connected. If your ticket system can't reliably join a support interaction to an account, a segment, and a renewal date, none of this rolls up. Getting your support data architecture and single source of truth right has to come before the metrics hierarchy — the tiers are only as trustworthy as the pipeline feeding them.
The connective tissue worth naming explicitly:
-
Tag every ticket to an account and segment, not just a category. Without this, you can never move from operational to outcome.
-
Attach a commercial dimension — renewal date, contract value, plan tier, lifecycle stage. This is what turns a ticket into a business signal.
-
Define which operational metrics trigger an outcome review. Not everything escalates. You decide the thresholds in advance.
-
Assign an owner at each tier so signals have somewhere to go instead of dying in a Slack channel.
None of these steps are technically hard. The hard part is getting agreement on them before you need them.
Decision triggers: the part everyone skips
Dashboards don't drive action. Triggers do. A trigger is a pre-agreed rule: when metric X crosses threshold Y, person Z does thing W. Without them, your hierarchy just becomes a nicer place to observe problems you're not responding to.
The mistake teams make is setting triggers only on operational metrics — "backlog over 200, add a shift." Fine for keeping the machine running, but it doesn't connect to commercial outcomes. The triggers that matter for support leadership are the ones that fire a business conversation.
A few outcome-oriented triggers worth building:
-
Reopen rate above threshold on high-value accounts → automatic flag to the account's CSM, not just an internal QA note. A reopened ticket on a $2k account is a quality issue. A reopened ticket on a $90k account is a retention risk.
-
Sentiment decline across a renewal cohort → escalate to a joint support/CS review before the renewal window opens, not after.
-
Contact rate spike on a specific feature within 30 days of launch → route to product with the adoption angle framed explicitly ("customers can't figure out the feature we bet the roadmap on").
-
Cost-to-serve creeping up in a segment → trigger a pricing or packaging conversation, since it may mean you're under-charging accounts that are expensive to support.
The discipline here is deciding these thresholds before the crisis, when you can think clearly. In the moment, everything feels urgent and nothing gets prioritized. Predefined triggers are how you keep the response proportional. If you want to go deeper on the mechanics of thresholds and ownable response playbooks, the approach in predicting workload and quality issues with leading indicators pairs directly with this — leading indicators are useless without the trigger logic that turns them into action.
Escalation routing that names an owner, not a team
"Route to the growth team" is where accountability goes to die. Escalation only works when a specific human owns the next step and there's a clock on it.
The routing logic should follow the tier the signal lives in. Leading indicators route horizontally — a team lead flags the spike to a peer or to product, fast and informal. Operational issues route up to the support manager who owns capacity and quality decisions. Business-outcome signals route into the commercial org — a named CSM, an account owner, sometimes finance.
What makes this actually function is a lightweight escalation packet. Not a novel — just enough context that the receiver can act without scheduling a meeting:
-
The signal — what moved, by how much, over what window
-
The affected slice — which accounts, segment, or product area
-
The commercial stake — dollars at risk, renewals in window, adoption gap
-
The recommended action — support isn't just throwing the problem over the wall, it's proposing the fix
-
The owner and deadline — one name, one date
Junior teams escalate problems. Support leadership escalates problems with a proposed decision attached. That's what earns support a seat in commercial conversations instead of being treated as a queue that occasionally complains.
The exec one-pager: translating the whole stack into one narrative
Executives don't read dashboards. They read stories, and they read them fast. The exec one-pager is where your three-tier hierarchy collapses into a single narrative a VP can absorb in ninety seconds.
The structure that works isn't "here are our metrics." It's "here's what happened, what it means for the business, and what we're doing about it."
Headline: the one thing that matters this period — "Support-attributable churn risk concentrated in mid-market billing experience."
The signal path: two sentences tracing how you saw it — leading indicator, operational confirmation, commercial impact. This is where the hierarchy proves its value.
The number that matters: one figure, framed commercially. Not "backlog hit 240" — "roughly $180k in renewals showing friction, of which we've stabilized about two-thirds."
The decision or ask: what you did, or what you need from them.
Everything else — the operational detail, the queue-by-queue breakdown — goes in an appendix. The most common mistake is treating the exec summary as a shrunk-down version of the ops dashboard. It's not. It's a different document written for a different reader with a different question.
A real scenario: from noise to a renewal save
A mid-sized B2B SaaS company — a workflow tool with a couple thousand accounts — had a support team drowning in what they called "random spikes." Volume would jump, they'd staff up, it'd settle, repeat. Nobody could predict it and nobody connected it to anything commercial.
When they built the tiered hierarchy, the first thing that surfaced was a leading indicator they'd never isolated: contact rate from accounts in their first 60 days was running roughly three times higher than mature accounts, and those same new accounts had noticeably lower CSAT. Operationally, this looked like generic backlog. Nobody had segmented it.
Once they connected the tickets to account data, the outcome-tier picture was ugly: a meaningful chunk of new accounts hitting heavy support friction were churning inside the first six months — somewhere around a quarter of that cohort, against a much lower rate for accounts that onboarded smoothly. That's not a support problem in the operational sense. That's revenue leaking out through an onboarding experience that support could see and nobody else could.
They built a trigger: any new-account cohort where first-30-day contact rate exceeded a set threshold routed a packet to the CS lead with the adoption gap named. Over the following two quarters, early-cohort churn dropped by a noticeable margin — not a dramatic overnight fix, but the kind of steady improvement you can actually attribute.
More importantly, support stopped being "the team that asks for headcount when it gets loud" and became the team that flagged a retention problem before finance saw it in the numbers. That shift in how the rest of the business perceived the support function was arguably worth more than the churn improvement itself.
When this hierarchy makes sense — and when it doesn't
This isn't free. Building and maintaining a three-tier metrics stack with triggers and routing takes real effort, and it's overkill for some teams.
When it makes sense:
-
You're past the point where one person can hold the whole support picture in their head — usually somewhere north of 15–20 agents or multiple product lines.
-
Your accounts vary meaningfully in value, so a ticket from one account isn't equivalent to a ticket from another.
-
Leadership is asking commercial questions about support that you currently can't answer.
-
Renewal and expansion revenue actually depends on experience, which is most B2B and subscription businesses.
When it's premature:
-
You're a small team where the manager already sees every important signal directly. Formalizing it just adds overhead you don't need yet.
-
Your data foundation is a mess. If you can't reliably connect a ticket to an account, building an outcome tier on top of that will produce confident, wrong numbers — which is worse than no numbers.
-
Support is genuinely transactional and low-stakes — high-volume consumer support where individual accounts carry little value and there's no renewal to protect.
Who should not do this: teams that will build the dashboards and skip the triggers. A metrics hierarchy with no decision rules and no owners is just a more elaborate way to watch problems unfold. If you're not going to wire the "so what happens next" into it, a simple operational wallboard will serve you better and cost you less.
Getting started without boiling the ocean
The temptation is to design the perfect three-tier system all at once. Don't. Start from the top and work down, because the whole point is commercial relevance.
Pick one business outcome you actually want to influence — say, first-year retention. Then work backward through the tiers:
-
Identify the business outcome you're targeting — first-year retention, expansion revenue, or cost-to-serve.
-
Map the operational metrics that move it — onboarding-cohort CSAT, early reopen rate, queue health by segment.
-
Identify the leading indicators that predict those — first-week contact rate, "how do I" query volume, sentiment in early-lifecycle tickets.
-
Define the trigger — the threshold that fires a response and routes it to a named owner.
-
Run one full cycle — signal fires, owner responds, outcome gets tracked.
Now you have one clean vertical slice through all three tiers. Get it working. Prove it saved or influenced something real. Then add the next slice — expansion, feature adoption, cost-to-serve. Each one you add makes the system more complete, and each one you can point to a concrete outcome it produced.
That's how support metrics stop being a wall of numbers nobody acts on and start being the thing the rest of the business pulls on when they want to know what's happening with customers — because you got there first.
Ready to transform your support operations?
Join 500+ support teams using Servyly to reduce resolution times, improve customer satisfaction, and boost team productivity.