



Most support teams don't have a data problem. They have a data trust problem. Two dashboards show different first-response times. The weekly report says CSAT is 91%, but the manager who reads every survey swears it feels lower. Someone exports a CSV, pivots it in a spreadsheet, and now there's a third version of the truth floating around Slack.
By the time you're arguing about whose number is correct, you've already lost the plot. Nobody's fixing anything—they're defending their spreadsheet.
The root cause almost always traces back to architecture, not tooling, not people. Support data gets stitched together from a help desk, a chat widget, a phone system, a survey tool, and maybe a CSAT platform—each one defining "resolution" and "response" slightly differently. Nobody sat down and decided what a ticket event actually is, when it's valid, or who owns the definition. So the numbers drift, and trust erodes with them.
This is a blueprint for fixing that at the source. Not "add another dashboard," but the actual plumbing: what signals to measure, how to structure the events feeding them, how to validate and retain the data, and who owns each piece so the metrics hold up under pressure.
Start With the Signals, Not the Dashboards
The mistake nearly every team makes is building dashboards first and figuring out the underlying data later. It's backwards. You end up with 40 widgets, half of which nobody trusts, and no clear line from a chart back to the raw thing that produced it.
Start instead with a small, deliberate catalog of Service Level Indicators (SLIs)—the specific, measurable signals that actually tell you whether support is healthy. Borrow the discipline from SRE teams but keep it grounded in support reality. An SLI isn't a goal (that's an SLO). It's the raw measured quantity: "percentage of tickets receiving a first human response within 60 minutes," measured exactly one way, from one source.
Here's a starter catalog worth defining precisely before you build anything on top of it:
| SLI | What it measures | Common definition trap |
|---|---|---|
| First Response Time | Time from ticket creation to first human reply | Counting auto-replies as "responses" |
| Time to Resolution | Creation to final resolved state | Not accounting for reopens or "solved then reopened" loops |
| Reopen Rate | % of resolved tickets reopened within N days | Different windows across teams (24h vs 7d) |
| Handle Volume per Channel | Tickets/conversations per channel per period | Merging chat sessions and email threads as equal "tickets" |
| Backlog Age | Distribution of open ticket ages | Reporting averages instead of percentiles |
| CSAT Coverage | % of resolved tickets that received a survey response | Reporting score without coverage—5 responses ≠ signal |
The trap column matters more than the definition column. In real operations, the fights over metrics almost always come from that column. One person counts the auto-acknowledgment as the first response; another doesn't. Suddenly your FRT looks 20 minutes better on one report. Neither person is wrong—they were just never given a single canonical rule.
Limit your initial SLI catalog to the handful of metrics you actually act on—this reduces debate and speeds consensus.
Pick your SLIs, write the exact definition for each, and treat that definition as law. If it's not in the catalog, it's not a metric you report on. That constraint alone kills most of the dashboard sprawl.
The Canonical Event Schema Is the Whole Ballgame
Once you know what you're measuring, the next question is what a piece of data even looks like when it enters your system. This is where support data architecture lives or dies.
Never lose track of a customer request again.
Servyly helps you track, assign, and resolve every ticket quickly and efficiently.
- Centralized ticket management
- Automated response workflows
- Team collaboration tools
No credit card required
Every meaningful thing that happens to a ticket should be captured as an event—an immutable record of something that occurred at a point in time. Not a snapshot of current state, but an event. "Ticket created." "Assigned to agent." "First response sent." "Status changed to pending." "Resolved." "Reopened." "Survey received."
The difference is enormous. If you only store current state, you can never reconstruct history. You can't answer "how long was this in the queue before someone touched it" because that moment is gone the instant status changes. Events preserve the timeline. State is derived from events, not the other way around.
A workable canonical event schema looks roughly like this:
-
event_id — unique, so you can dedupe
-
eventtype — from a controlled list (
ticketcreated,firstresponse,statuschanged,reopened, etc.) -
ticket_id — the entity it belongs to
-
occurred_at — when it actually happened, in UTC, always
-
recorded_at — when your system logged it (these differ more than you'd think)
-
actor — who or what triggered it (agent ID, customer, automation)
-
channel — email, chat, phone, portal
-
segment — customer tier or plan, captured at event time
-
payload — the type-specific details (old status, new status, response text length, etc.)
-
source_system — which tool emitted it
Two fields carry surprising weight here. First, occurredat vs recordedat. When a phone log syncs two hours late, or a chat transcript posts after the session closes, those timestamps split apart. If you only keep one, your time-based SLIs quietly corrupt. Keep both and you can always tell whether a weird number is a real problem or just a sync delay.
Second, segment captured at event time. A customer might be on the Starter plan when they file a ticket and Enterprise a month later. If you join segment from the current customer record, you'll retroactively rewrite history and your segment-level SLA reporting becomes fiction. Capture it at the moment the event happens and freeze it. This matters enormously if you're doing anything with SLAs and SLOs defined by customer segment—the whole model falls apart if segment assignment drifts under you.
Validation and Retention: The Unglamorous Part That Keeps You Honest
Nobody wants to talk about validation rules. They're boring. They're also the reason your data is either trustworthy or garbage.
Every event entering the pipeline should pass through validation gates before it lands in the source of truth. The point isn't perfection—it's catching obvious corruption before it poisons a dashboard three layers downstream.
A practical validation set:
-
Required fields present — no event without
eventid,ticketid,eventtype,occurredat -
Enum enforcement —
event_typeandstatusmust match the controlled list; rejectResolved,resolved, andRESOLVEDbeing treated as different values -
Timestamp sanity —
occurredatcan't be in the future;recordedatshouldn't precedeoccurred_atby any margin that makes no sense -
Sequence logic — you can't get a
firstresponsebefore aticketcreated; flag ordering violations -
Dedup on event_id — same event arriving twice (webhook retries love to do this) gets collapsed
Webhook retries and integration double-fires are the silent killers in most support data setups. A help desk sends the same "resolved" event three times during a network hiccup. Without dedup, your resolution count inflates and your reopen math breaks. It's not dramatic—it's a slow drip of small errors that makes people distrust the whole system without knowing exactly why.
Retention deserves a deliberate decision too. Raw events are cheap to store and priceless when you need to debug or recompute a metric after finding a definition bug. A reasonable pattern:
-
Raw events — keep 18–24 months, immutable, never edited
-
Cleaned/validated layer — kept alongside raw; this is what dashboards query
-
Aggregated rollups — daily and weekly summaries, kept longer (years) since they're small
-
PII handling — strip or hash message content on a shorter clock per your policy, but keep the structural event
The reason you keep raw events even after aggregating: when you discover that FRT was counting auto-replies wrong, you want to recompute the last six months correctly, not shrug and say "well, going forward." Teams that only keep rollups can never fix their own history.
Building the Pipeline: From Event to Dashboard to Action
Here's how the pieces actually connect in a working system. Think of it as a one-way flow with clear stages, not a tangle.
The workflow, in order:
-
Emit — Each source system (help desk, chat, phone) sends events to a single ingestion endpoint. If a tool can't emit events, you poll its API on a schedule and translate its state changes into your canonical events.
-
Validate — Events hit the validation gates above. Passes go forward; failures land in a quarantine queue with the rejection reason attached—never silently dropped.
-
Normalize — Map every source's vocabulary into your canonical schema.
sourcesystem: zendesk"solved" becomes canonicalstatuschanged → resolved. This is where source drift gets absorbed. -
Store — Land in the raw event store (immutable) and the cleaned layer (queryable).
-
Compute SLIs — Derived metrics get calculated from cleaned events on a defined cadence. Because they trace back to raw events, anyone can audit a number to its source.
-
Serve — Dashboards and automations read only from the computed SLI layer. Nothing reads raw data directly for reporting. This is what stops the "three versions of FRT" problem.
A simple diagram of this one-way flow makes it clear how each stage connects.
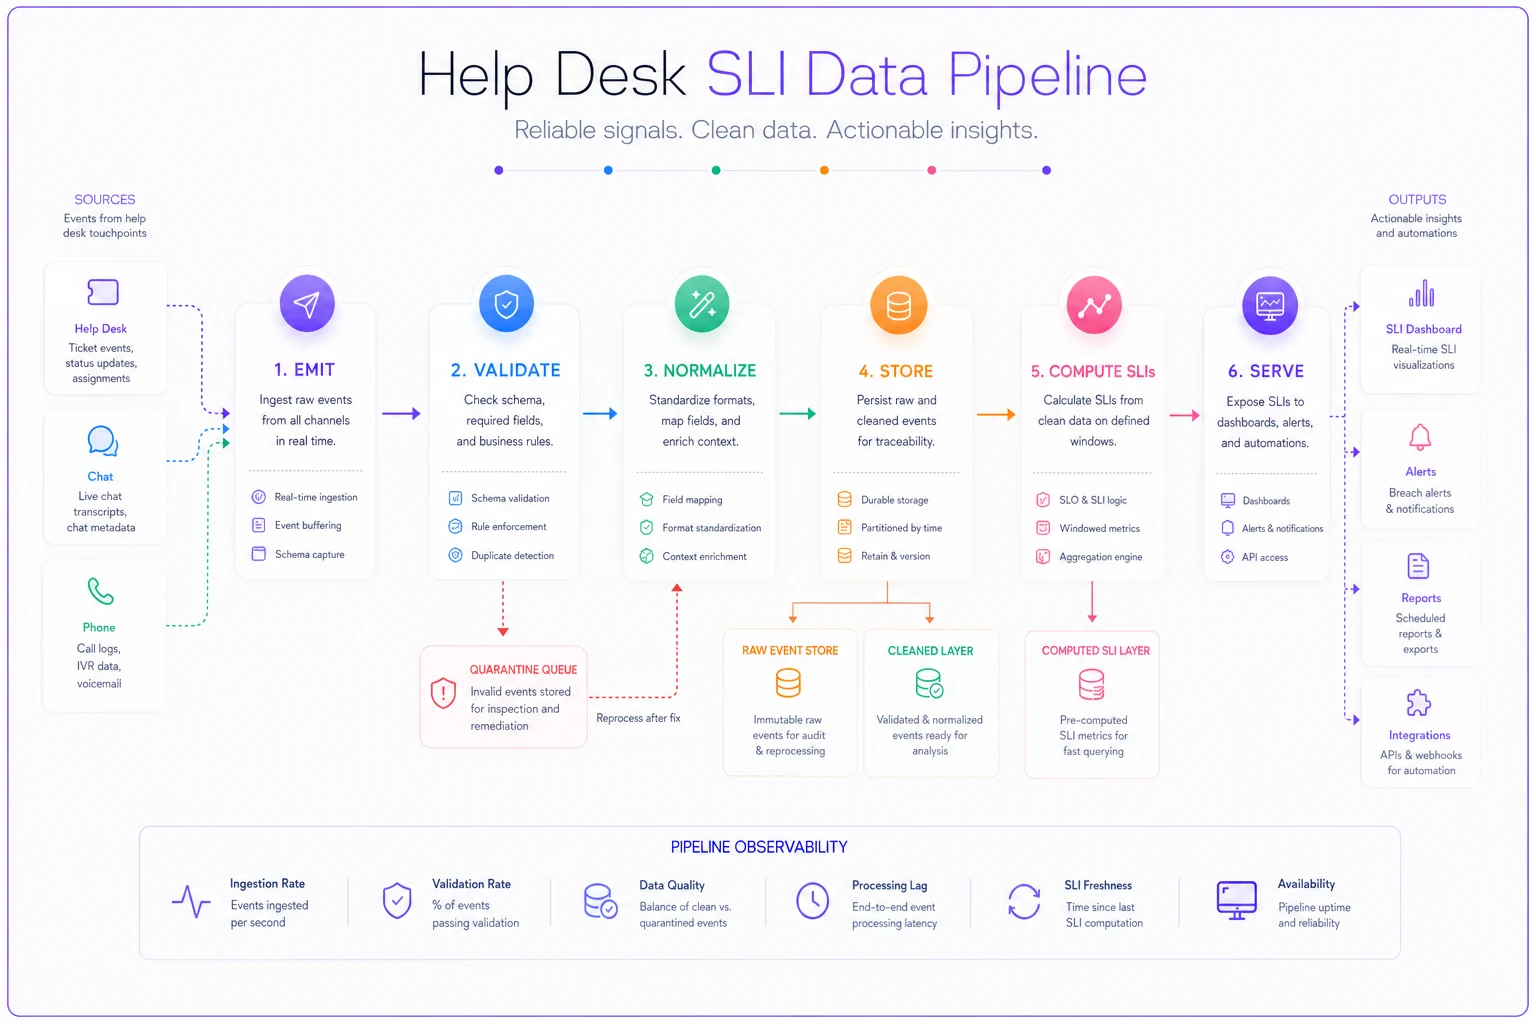
The critical design rule hiding in there: dashboards and automations consume the same computed layer. When your breach alerts and your weekly report both pull from identical SLI computations, they can't disagree. That single decision eliminates the most common source of support-metric arguments.
This computed layer is also what makes predictive work possible. Once you've got clean, event-based history, you can start spotting the leading indicators that predict workload and quality problems before they hit—rising backlog age slopes, reopen-rate creep, coverage gaps. You can't forecast on data you don't trust.
An Ownership Model That Actually Holds
Data without owners rots. Most blueprints skip this part, and it's the part that determines whether any of this survives past the first quarter.
The failure pattern is predictable: someone builds a solid pipeline, they leave or get reassigned, a source system changes its API, an event type silently stops flowing, and nobody notices for three weeks. By then the damage is baked into a board report.
Assign ownership at three distinct levels:
-
Metric definition owner — usually a support ops lead or manager. Owns the meaning of each SLI. When someone asks "why did FRT jump," this person answers, and this person alone approves definition changes. Definitions change through a documented request, never a quiet edit.
-
Pipeline owner — the person responsible for events flowing, validation passing, and the quarantine queue not silently piling up. They get alerted when ingestion volume drops unexpectedly (a dead integration looks exactly like a "quiet week" until you check).
-
Consumer owner per dashboard/automation — whoever depends on a given view owns confirming it still means what they think. Orphaned dashboards are a liability; if nobody owns a report, retire it.
A small but powerful practice: a metric changelog. Every time a definition changes—say you finally fix the auto-reply bug in FRT—log the date, what changed, and why. Now when a number shifts, people check the changelog instead of assuming the data broke. It converts "the numbers are lying again" into "oh, we corrected the FRT definition on the 14th." That habit rebuilds trust faster than any dashboard redesign.
A Real Scenario: The 12-Person Team That Couldn't Trust Its Own Numbers
A mid-sized SaaS support team—around 12 agents handling roughly 3,000–3,500 tickets a month across email and chat—ran into the classic wall. Their help desk reported one first-response time, their chat tool reported another, and the CS leader's weekly deck used a hand-built spreadsheet that matched neither. Every Monday meeting burned 20 minutes debating which number was real.
The actual problem, once they traced it: chat "conversations" and email "tickets" were being averaged together as if equal, auto-acknowledgment emails counted as first responses in one system but not the other, and reopens were being counted as brand-new resolutions—inflating their resolution numbers by somewhere around 8–12%.
They rebuilt around a canonical event model. Every channel emitted events into one schema. FRT got a single definition (first human response, auto-replies excluded). Reopens became explicit events tied to the original ticket. Dashboards and breach alerts started reading from one computed layer.
Their reported first-response time got worse on paper—it went from a flattering ~35 minutes to an honest ~58 minutes—because they stopped counting auto-replies. But for the first time, nobody argued about it. The Monday debate disappeared. And because the reopen loop was now visible, they caught that a chunk of their "resolutions" were bouncing back within 48 hours, which pointed them at a specific documentation gap they'd been blind to. Not a revenue miracle—just clarity. And clarity is what lets you actually fix things.
When This Level of Rigor Makes Sense (and When It Doesn't)
When it's worth it: You have more than one channel, more than one source system, or more than one person arguing about numbers. Once you're reporting metrics to leadership or tying them to SLAs, the cost of untrustworthy data outweighs the cost of building the pipeline. Multi-tool setups basically require it.
When it's overkill: A solo founder or a two-person team on a single help desk doesn't need an event pipeline. If everything lives in one tool with one built-in definition, use the native reporting and move on. Building canonical schemas for 200 tickets a month is a hobby, not operations.
Who should NOT start here: Teams whose bigger problem is that they haven't decided what "resolved" even means. Architecture can't rescue you from undefined concepts. Nail down definitions and ownership on paper first—the plumbing comes after you know what you're measuring.
There's also a middle path a lot of growing teams miss: you don't have to build all of this from scratch. Plenty of modern support platforms already model events under the hood and let you define canonical metrics and validation rules without standing up your own data infrastructure. If the tooling handles the event schema and single-source-of-truth layer for you, your job shrinks to the two things that genuinely require human judgment—choosing your SLIs and assigning ownership. That's a much better use of a support team's time than maintaining pipelines.
Where to Start This Week
You don't need to build the whole thing at once. The highest-leverage moves are the cheap ones:
-
Write down the exact definition for your top five SLIs and get one person to own each
-
Pick your single canonical rule for "first response" and "resolution," and kill the competing versions
-
Identify where your current numbers disagree—that disagreement is a map to your worst definition traps
-
Start capturing segment at event time if you report anything by customer tier
-
Create a metric changelog, even if it's just a shared doc
Trustworthy support data isn't about having more dashboards or fancier charts. It's about deciding, once and clearly, what each number means and where it comes from—then building the pipeline so that decision holds under pressure. Get the events right at the source, and everything downstream stops being a fight and starts being something you can actually act on.
Trustworthy support data isn't about having more dashboards or fancier charts. It's about deciding, once and clearly, what each number means and where it comes from—then building the pipeline so that decision holds under pressure. Get the events right at the source, and everything downstream stops being a fight and starts being something you can actually act on.
Ready to transform your support operations?
Join 500+ support teams using Servyly to reduce resolution times, improve customer satisfaction, and boost team productivity.