


Finance walks into your quarterly review and asks a question that sounds simple: "Which products are driving your support costs?" You open your ticketing dashboard, pull ticket counts by tag, and point at the top three. Someone from product leans in and says, "Those tickets are mostly five-minute password resets. Our product generates fewer tickets but each one takes an hour." And just like that, your clean chart falls apart in the room.
That gap — between raw ticket volume and actual cost consumed — is where most support cost allocation attempts die. The number on the slide doesn't match anyone's lived reality, so the whole conversation gets dismissed as "support politics" and nobody chargebacks anything. The team keeps absorbing cost invisibly, and support stays a cost center nobody can defend at budget time.
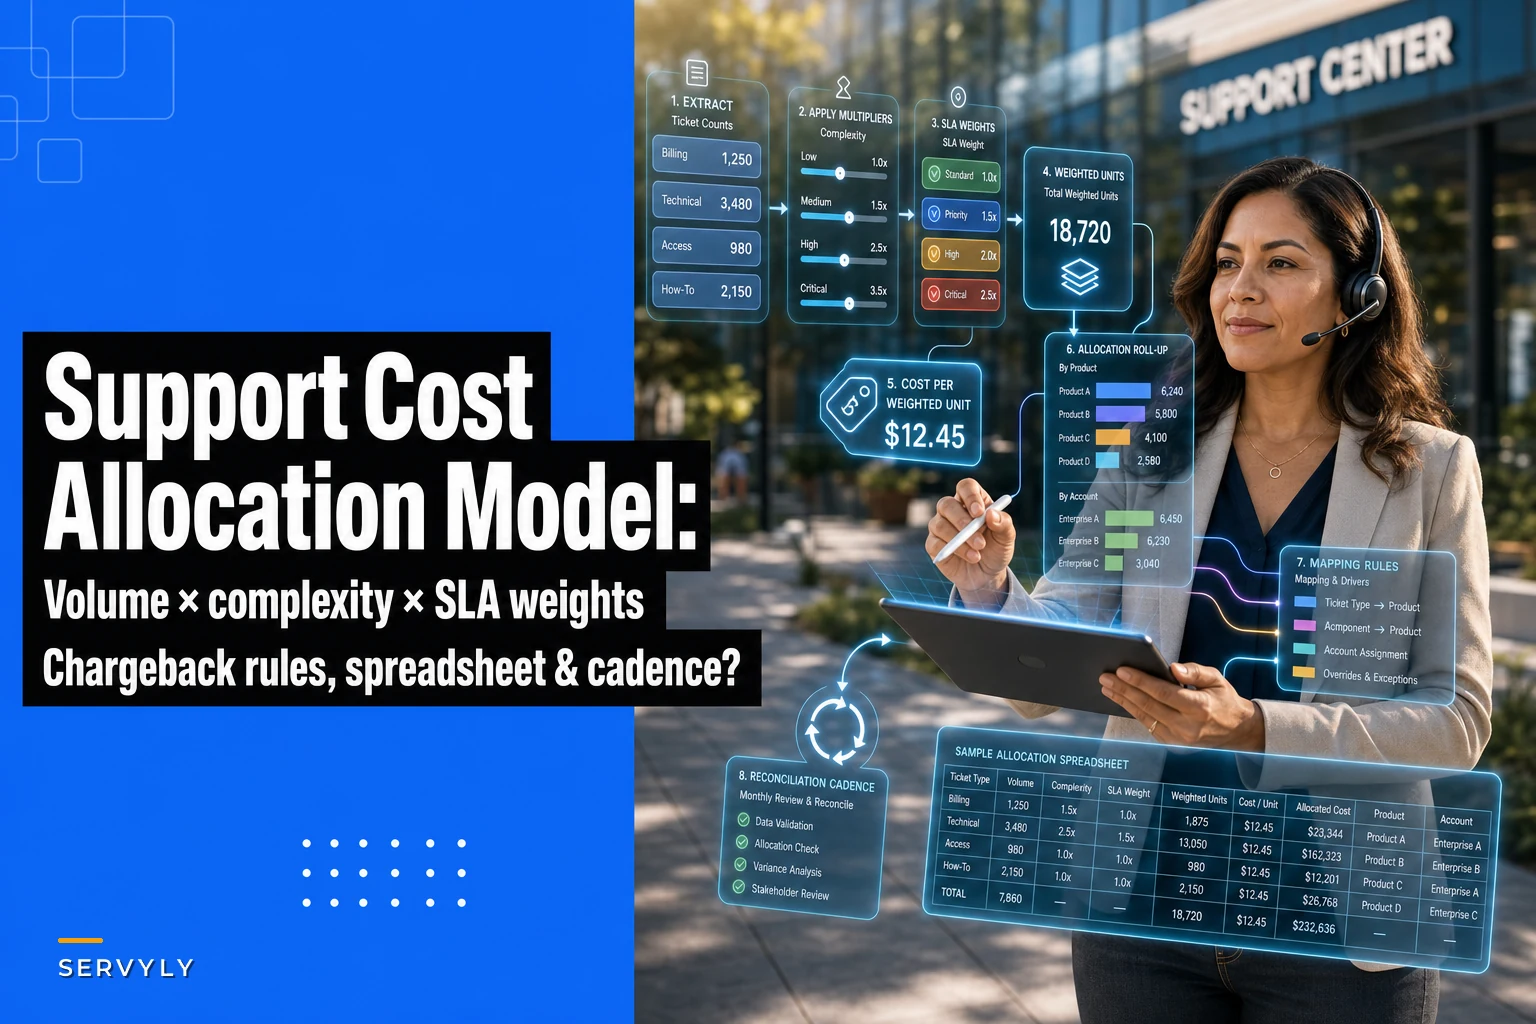
This post walks through a model that holds up: cost per ticket weighted by volume × complexity × SLA weight, mapped from ticket to product to account, with a reconciliation cadence that keeps finance and product honest. There's a worked spreadsheet layout you can rebuild in an afternoon.
Why ticket counts lie to you
Ticket volume feels like the natural unit of cost because it's the thing you can count without any extra work. The problem is that two tickets almost never cost the same.
A password reset handled by automation or a tier-1 agent in four minutes costs a fraction of what a data-sync failure costs — the data-sync ticket pulls in an escalation, a reproduction packet, maybe 40 minutes of senior engineer time, and three follow-up touches before it closes. Allocate cost by count and the password-heavy product looks expensive while the complex one looks cheap. That's backwards, and product teams know it, which is exactly why they'll shred any allocation built on raw counts.
The second thing counts miss is SLA pressure. An enterprise account on a one-hour response SLA consumes capacity differently than a self-serve account on a next-business-day target, even for the same ticket type. The enterprise ticket forces you to hold staffed headroom, interrupt queues, and sometimes pull people off other work. That reserved capacity is real money, and it doesn't show up anywhere in a count.
So the model needs three inputs, not one:
-
Volume — how many tickets, by type
-
Complexity — how much handling time and escalation each type actually consumes
-
SLA weight — how much reserved capacity the target forces you to carry
Multiply those together and you get something that approximates consumed cost instead of a tally.
The three factors, defined so they're defensible
The trap here is inventing factors that feel precise but can't be explained. If product asks "where did 2.4 come from?" and your answer is "it felt about right," you've lost the room. Every number needs a source.
Never lose track of a customer request again.
Servyly helps you track, assign, and resolve every ticket quickly and efficiently.
- Centralized ticket management
- Automated response workflows
- Team collaboration tools
No credit card required
Volume is the easy one — it comes straight from your ticketing system, grouped by ticket type. No invention required.
Complexity should be grounded in handle time, not opinion. The cleanest approach is to bucket ticket types into a few tiers based on median handle time plus escalation rate, then assign each tier a multiplier relative to your baseline. Use median, not average, so one nightmare ticket doesn't drag the whole tier.
| Complexity tier | Median handle time | Escalation rate | Multiplier |
|---|---|---|---|
| Simple (T1) | under 10 min | near 0% | 1.0 |
| Moderate | 10–30 min | under 15% | 2.2 |
| Complex | 30–75 min | 15–40% | 4.0 |
| Critical / eng | 75 min+ | 40%+ | 7.5 |
The multipliers aren't magic — they roughly track the combined cost of handle time plus the loaded cost of escalations that tier triggers. The important part is that you can point at the two columns on the left and say "that's why." Finance accepts ranges backed by data far more readily than invented precision.
SLA weight captures the capacity premium of tight targets. A simple, honest version: assign a small uplift to tiers that require staffed headroom.
-
Next-business-day / self-serve
1.0
-
Same-day
1.15
-
4-hour response
1.3
-
1-hour / enterprise
1.5
That 1.5 isn't saying enterprise tickets take 50% longer to handle — they often don't. It's saying you carry reserve capacity to hit that one-hour promise, and the accounts under that SLA should wear that cost. This single factor is usually what makes product and account teams nod instead of argue, because it names something everyone feels but nobody has ever put a number on.
The worked spreadsheet
Here's the layout. Build it per product, then roll up to account. Numbers below are for a mid-size SaaS support team over one month, cost-per-handled-minute set at roughly $1.10 fully loaded.
Step 1 — ticket base, by product and type:
| Product | Ticket type | Tier | Volume | Complexity mult | SLA tier | SLA weight |
|---|---|---|---|---|---|---|
| Billing | Invoice question | Simple | 420 | 1.0 | Same-day | 1.15 |
| Billing | Refund dispute | Moderate | 95 | 2.2 | Same-day | 1.15 |
| Sync Engine | Connector failure | Complex | 60 | 4.0 | 4-hour | 1.3 |
| Sync Engine | Data mismatch | Critical | 18 | 7.5 | 1-hour | 1.5 |
| Mobile App | Login issue | Simple | 310 | 1.0 | Self-serve | 1.0 |
Step 2 — weighted units. For each row: Volume × Complexity × SLA weight.
-
Invoice question
420 × 1.0 × 1.15 = 483
-
Refund dispute
95 × 2.2 × 1.15 = 240
-
Connector failure
60 × 4.0 × 1.3 = 312
-
Data mismatch
18 × 7.5 × 1.5 = 203
-
Login issue
310 × 1.0 × 1.0 = 310
Total weighted units this month: 1,548.
Step 3 — allocate the pool. Say the support team's fully loaded monthly cost sitting in the allocatable pool is around $142k. Cost per weighted unit = 142,000 ÷ 1,548 ≈ $91.70.
Here's a quick visual of the workflow from ticket counts to allocated cost.
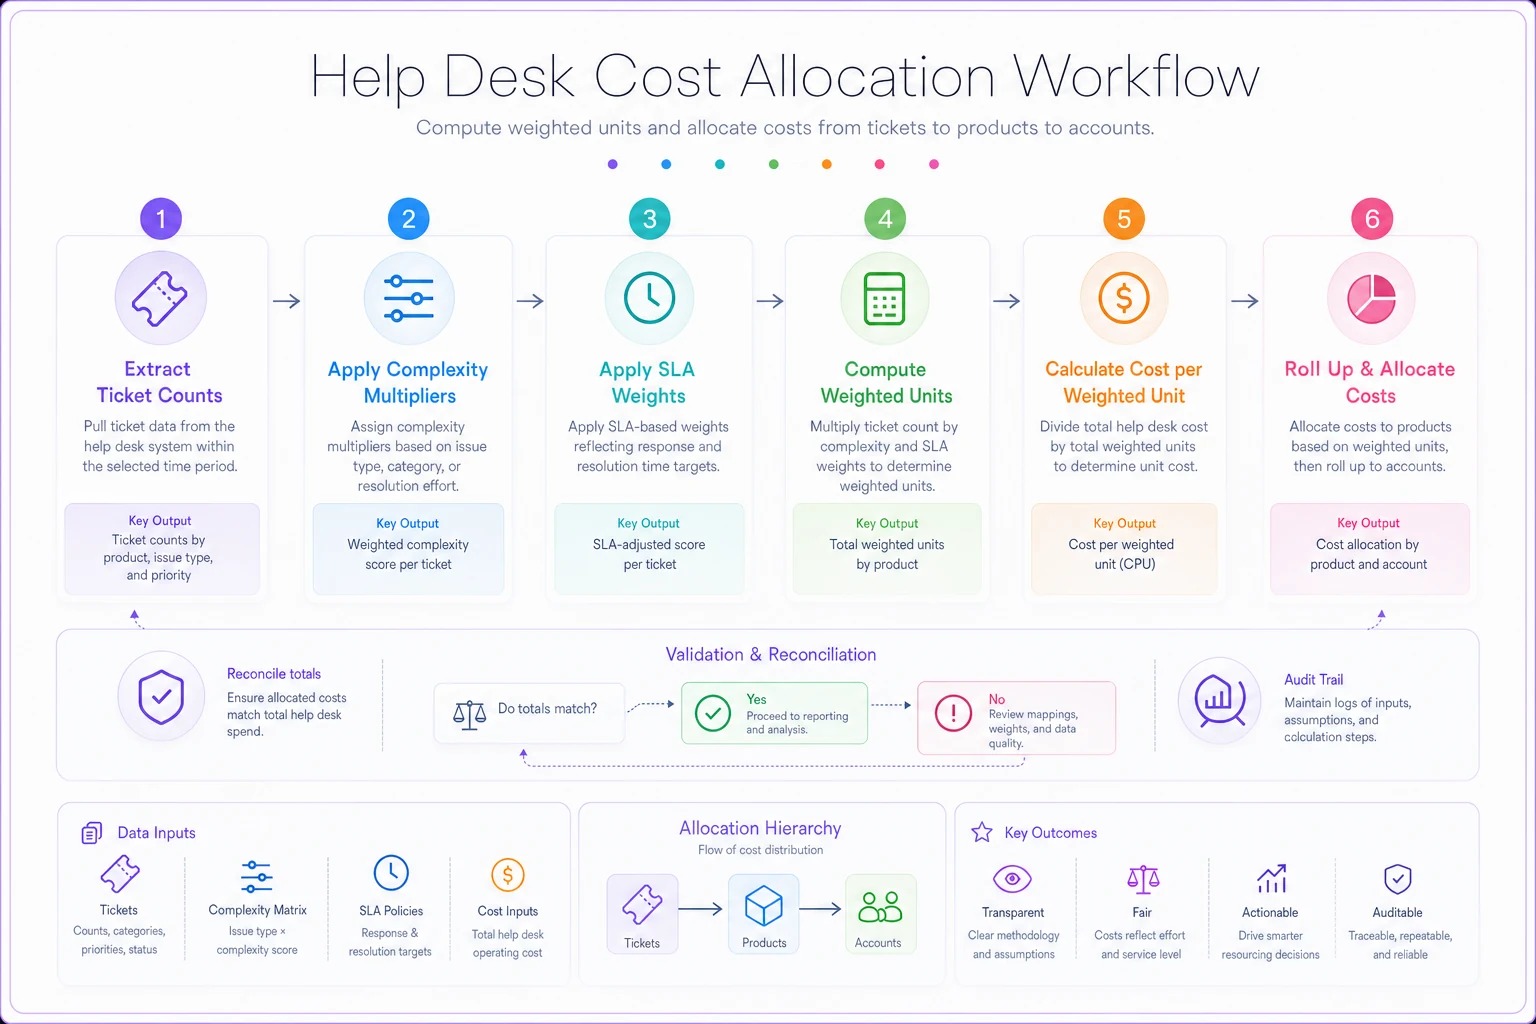
This diagram maps directly to the numbered steps above and the tables below.
Use rolling medians (e.g., 90 days) for handle time when setting complexity tiers so short-term spikes don't move a ticket type between multipliers.
Step 4 — cost per product:
| Product | Weighted units | Allocated cost |
|---|---|---|
| Billing | 483 + 240 = 723 | ≈ $66.3k |
| Sync Engine | 312 + 203 = 515 | ≈ $47.2k |
| Mobile App | 310 | ≈ $28.4k |
Now look at what the naive count view would have said. By raw volume, Billing (515 tickets) and Mobile (310) dwarf Sync Engine (78 tickets). Sync Engine looks like a rounding error. Under weighted allocation, Sync Engine eats a third of the pool off 8% of the tickets. That's the conversation product actually needs to have — and it's the one raw counts hide completely.
Mapping rules: ticket → product → account
The model only works if every ticket reliably maps to exactly one product and one account. This is where most implementations quietly break, usually because the mapping lives in agents' heads instead of in rules.
You need three mapping layers, each with a clear owner:
-
Ticket → product. Driven by ticket type and tag taxonomy, not free-text. If a ticket can plausibly belong to two products (a sync failure that surfaces as a billing error, say), you need a tiebreak rule — typically "map to the product that owns the root cause, not the symptom." Write that rule down once; don't re-litigate it per ticket.
-
Ticket → account. This comes from your CRM link on the requester. The failure mode is tickets from shared inboxes or unrecognized domains landing in an "unmapped" bucket. Cap unmapped at something like 5% of volume, and allocate that residual proportionally rather than letting it distort one product.
-
Account → segment/entity. So finance can roll support cost up to the same account hierarchy they use for revenue. If your support account IDs don't reconcile to finance's account IDs, nothing downstream will tie out, and you'll spend reconciliation meetings arguing about which "Acme" is which.
A clean taxonomy is the whole foundation here. If your tags are a sprawl of duplicates and dead labels, this model produces garbage. If tool and tag sprawl is part of your problem, the groundwork in the support technology roadmap for preventing tool sprawl and SLA risk is worth sorting out before you try to allocate anything.
Reconciliation cadence that keeps everyone honest
An allocation model built once and never revisited drifts within a quarter. Handle times shift, new ticket types appear, SLA mixes change. The cadence is what keeps the number trustworthy enough that finance will actually chargeback on it.
A workable rhythm looks something like this:
-
Monthly — support owns. Refresh volume and recompute weighted units. Flag any ticket type whose median handle time moved enough to bump it a complexity tier. Report the unmapped percentage.
-
Quarterly — support + finance. Re-derive cost per weighted unit against the actual loaded pool. Confirm account IDs still reconcile to finance's hierarchy. Lock the number that goes into chargeback.
-
Twice a year — support + product + finance. Review the complexity multipliers and SLA weights themselves. These are the "constitution" of the model; changing them mid-cycle destroys trust, so you only touch them on a scheduled date with all three parties in the room.
The discipline that matters most: freeze the multipliers between review dates. The fastest way to kill an allocation model is to let whichever team is unhappy with its number lobby to tweak a multiplier off-cycle. Once people believe the factors are negotiable per-meeting, the whole thing becomes a bargaining exercise instead of a measurement.
A real scenario
A roughly 14-person support team at a B2B analytics company was absorbing cost invisibly. Leadership knew support spend was climbing but couldn't attribute it, so every budget cycle support got squeezed as "overhead."
They built this model over about three weeks. The surprise wasn't a product — it was an account. One mid-tier customer, maybe 2% of revenue, was generating a stream of complex connector tickets under an inherited 1-hour SLA from an old contract. Under weighted allocation, that single account was consuming close to $9k a month in support cost — more than several accounts paying 5x the ARR.
That number changed two conversations. Finance flagged the account for a contract review at renewal. Product prioritized a connector stability fix that had been sitting untouched because, under ticket counts, it "only" affected 18 tickets a month. Six months out, connector ticket volume for that product dropped by roughly half, and the renewal moved the account to a standard SLA tier. Nothing dramatic happened to revenue — but support stopped being the line item nobody could defend.
When this makes sense — and when it doesn't
This model earns its keep when support cost is large enough to matter and product/account decisions actually depend on attribution. If you're routinely losing the "which product should fund this?" argument in budget meetings, you need it.
It's not worth the overhead if you're a small team supporting a single product with uniform SLAs — there's nothing to allocate across. Building a weighted model to split cost you're not going to chargeback anyway is busywork. A better use of your energy in that situation is the cost-to-serve portfolio framework for deciding when to insource, outsource, or automate, which answers a different and more useful question at that scale.
One warning on who should not run this: anyone who can't get finance to agree on the account hierarchy first. If support account IDs and finance account IDs don't reconcile, you'll produce beautifully weighted numbers that tie out to nothing, and the model gets thrown out the first time someone tries to match it to the P&L. Fix the ID mapping before you compute a single weighted unit.
The point of the exercise
Raw ticket counts make support look like a volume machine, which pushes everyone toward the wrong conclusion — that the cheapest fix is deflecting the high-count stuff. The weighted model surfaces the opposite truth more often than not: a small number of complex, tightly-SLA'd tickets, frequently concentrated in one or two products or accounts, is where the money actually goes.
Once that's visible and reconciled against finance's own numbers, support stops being overhead you defend and becomes a cost you can attribute, forecast, and — when it makes sense — hand the bill to the team or account that's actually driving it. That's the whole game: not a prettier chart, but a number product and finance both stop arguing with.
Once that's visible and reconciled against finance's own numbers, support stops being overhead you defend and becomes a cost you can attribute, forecast, and — when it makes sense — hand the bill to the team or account that's actually driving it. That's the whole game: not a prettier chart, but a number product and finance both stop arguing with.
Ready to transform your support operations?
Join 500+ support teams using Servyly to reduce resolution times, improve customer satisfaction, and boost team productivity.