
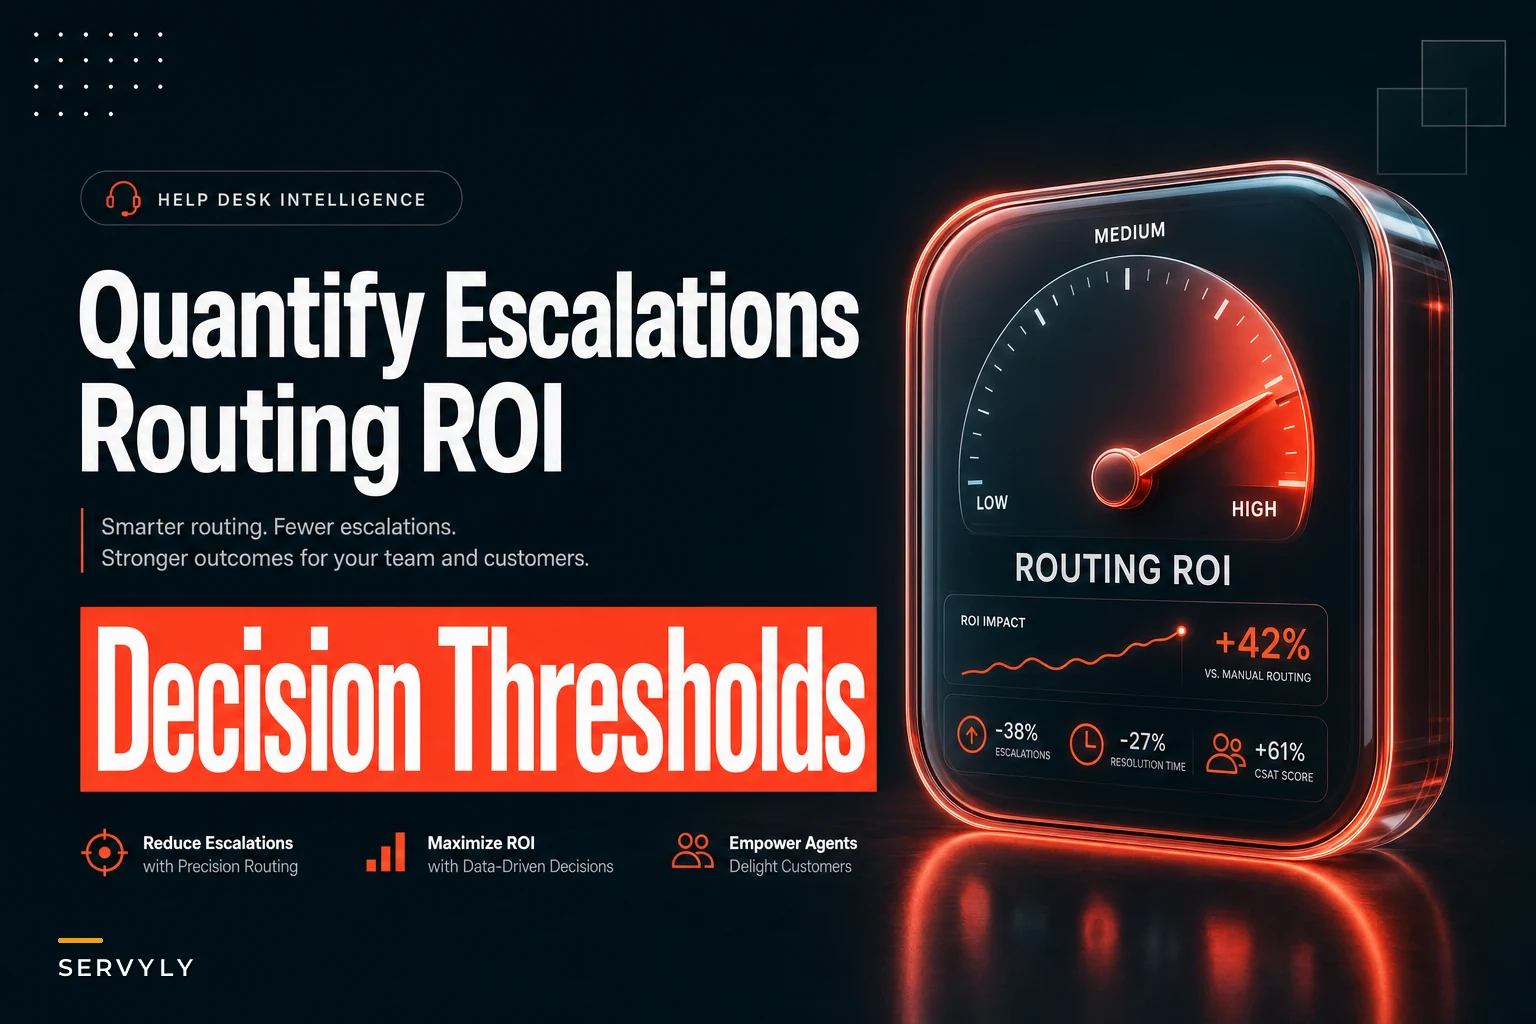

Most support teams treat escalations as a binary reflex. Ticket looks hard, agent can't fix it in five minutes, off it goes to tier 2 or engineering. Nobody runs the math on whether that call was worth it. And because escalations feel like "doing the right thing for the customer," they rarely get questioned.
But every escalation has a real price. Not a metaphorical one — an actual, computable cost that includes the receiving team's time, the customer's extended wait, the coordination overhead, and the opportunity cost of whatever that senior engineer wasn't doing while they dug into your ticket. Once you put a number on it, a lot of routine escalations start looking like bad trades.
This post gives you a lightweight model to compute the cost of escalations support decisions actually carry, a set of decision thresholds you can defend in a staffing meeting, and a couple of worked examples so you can plug in your own numbers.
Start with the two costs nobody adds up
When people say an escalation is "expensive," they usually mean one thing. There are actually two distinct costs, and you need both to make a good routing decision.
Direct handling cost is the labor you can see on a timesheet. If a tier-2 engineer spends 40 minutes on an escalated ticket and their loaded cost is roughly $60/hour, that's about $40 of direct cost. Simple.
Opportunity cost is the thing that never shows up in a report. That same engineer had a queue of higher-leverage work — a bug fix that would prevent 30 future tickets, a KB gap they were supposed to close, a customer with a genuinely novel problem. Every minute spent on an escalation that a well-equipped tier-1 agent could have resolved is a minute taken from that work.
The mistake most teams make is optimizing for direct cost while ignoring opportunity cost entirely. They route aggressively to senior people because "they solve it faster," never noticing that the fast resolution came at the expense of work worth 5x more.
A rough pattern across support orgs: the true cost of an escalation is usually 2–4x the direct labor cost once you fold in opportunity cost and the customer-wait penalty. If you're only counting the timesheet number, you're underpricing escalations by more than half.
The simple routing model
For any ticket type, you're comparing two paths:
Never lose track of a customer request again.
Servyly helps you track, assign, and resolve every ticket quickly and efficiently.
- Centralized ticket management
- Automated response workflows
- Team collaboration tools
No credit card required
Path A — Resolve at current tier. The agent handles it now, possibly slower, possibly with a lower first-contact resolution rate.
Path B — Escalate. Higher probability of resolution, but you pay handling cost + coordination cost + extra wait.
You escalate when the expected value of Path B beats Path A. That's it. The trick is quantifying the pieces.
The variables you need
-
presolvehere — probability the current tier resolves it (per ticket, for this category)
-
t_here — average handling time if resolved at current tier
-
c_here — loaded hourly cost of the current-tier agent
-
presolveesc — probability the escalation target resolves it
-
t_esc — handling time at the escalation target
-
c_esc — loaded hourly cost of the escalation target
-
k_coord — coordination overhead (context handoff, writing up the packet, back-and-forth)
-
w_penalty — the cost of the additional customer wait (churn risk, CSAT hit, SLA breach exposure)
The comparison
Cost to resolve here ≈ (there × chere) + [failure cost if it doesn't resolve]
Cost to escalate ≈ kcoord + (tesc × cesc) + wpenalty + [failure cost if escalation also fails]
The failure cost matters more than people expect. If tier 1 attempts a fix, fails, then escalates anyway, you paid for the attempt plus the escalation plus a longer total wait. That double-payment is where a lot of hidden money leaks out of the system.
Putting numbers on the wait penalty
The wait penalty is the variable most teams hand-wave past. Here's a defensible way to estimate it without pretending you have perfect data.
Pick a per-ticket-category churn or dissatisfaction sensitivity. For a billing dispute, an extra 24 hours of wait might carry real churn risk on a $40/month account. For a "how do I export a CSV" question, the extra wait costs almost nothing measurable.
A practical shortcut: express the wait penalty as a fraction of the customer's monthly value, scaled by how time-sensitive the issue is.
| Ticket sensitivity | Example category | Wait penalty per extra day |
|---|---|---|
| Low | how-to, feature questions | ~$0–1 |
| Medium | config issues, integration setup | ~$3–8 |
| High | billing errors, access loss, outages | ~$15–40+ |
These aren't universal numbers — they're the shape of what you'll find. High-sensitivity issues carry a wait penalty large enough that fast escalation is almost always worth it. Low-sensitivity issues carry a penalty so small that escalation almost never pays unless the resolution probability at tier 1 is genuinely terrible.
Worked example 1: the "just escalate it" reflex
A B2B SaaS help desk gets a recurring category: SSO login failures. Tier 1 has been escalating almost all of them to the identity engineering team because "it's an auth thing."
Let's price both paths.
Resolve at tier 1:
-
presolvehere = 0.55 (tier 1 can fix roughly half with a decent runbook)
-
there = 25 min, chere = $35/hr → ~$14.60
-
If they fail (45% of the time), they escalate anyway, adding the escalation cost below
Escalate to engineering:
-
k_coord = ~$12 (writing up context, the handoff conversation)
-
tesc = 30 min, cesc = $90/hr → $45
-
w_penalty = ~$8 (medium sensitivity, extra ~half day of wait)
Total per escalation ≈ $65
Now the aggregate math on 100 SSO tickets under the current "escalate everything" policy:
-
100 × $65 = $6,500
-
Under a policy where tier 1 attempts first with the runbook
-
100 attempts × $14.60 = $1,460
-
45 failures escalate
45 × $65 = $2,925
-
Total ≈ $4,385
That's roughly a $2,100 savings per 100 tickets, and SSO failures were running a few hundred a month. The catch: it only works because tier 1's resolve probability was 0.55. If a good runbook could push that to 0.70, the gap widens further.
The lesson isn't "always resolve locally." It's that the escalate-everything reflex was costing real money because nobody had ever priced the alternative.
Worked example 2: when escalating is clearly correct
Same team, different category: suspected data-integrity bugs where a customer reports wrong numbers in a report.
-
presolvehere = 0.10 (tier 1 basically can't diagnose this)
-
Attempting anyway burns ~20 min and usually ends in escalation regardless
-
w_penalty = ~$30 (high sensitivity — customers panic about wrong data)
The calculation flips completely. Tier 1 attempts add cost and delay with almost no payoff. The right move is a fast-path escalation with no local attempt — skip straight to the engineering handoff.
This is the decision most teams get backwards. They let tier 1 flail on hard, time-sensitive tickets where local resolution probability is near zero, and escalate the easy ones out of habit. The model tells you to do the opposite: attempt locally when presolvehere is high, fast-path when it's low and the wait penalty is high.
The decision thresholds
You don't want agents running spreadsheets in the middle of a shift. You want three or four defensible rules baked into routing. Here's the threshold logic distilled:
-
If presolvehere ≥ 0.60 and wait sensitivity is low or medium → resolve locally first. The attempt is cheap and usually succeeds.
-
If presolvehere ≤ 0.20 → fast-path escalate, no local attempt. The attempt is pure waste; you'll escalate anyway and you'll have burned time doing it.
-
If wait penalty is high (billing, access, outages) → escalate quickly regardless of presolvehere, because the customer-wait cost dominates everything else.
-
The murky middle (presolvehere 0.20–0.60, low sensitivity) is where you invest in tooling — better runbooks, better search — to push presolvehere up and out of the murk. Don't solve the middle with routing; solve it by making local resolution more likely.
That fourth point is the one teams consistently skip. The middle band isn't a routing problem, it's a capability problem. Throwing more escalations at it just moves the cost around without fixing anything.
Where the coordination cost actually hides
The k_coord variable is where a lot of teams underestimate the true price. A sloppy handoff means the receiving engineer spends 15 minutes reconstructing what the customer said, what's already been tried, and what the actual reproduction steps are. Multiply that across a few hundred escalations a month and the coordination cost alone can rival the handling cost.
This is why the quality of your escalation packet directly changes the ROI math. A tight, reproducible handoff might carry $4 of coordination cost; a vague one might carry $18. If you want to lower the cost of every escalation without changing your routing rules at all, tightening the handoff is the highest-leverage move. We've written about building a reproducible escalation packet and triage filters that does exactly this — it's the single fastest way to shrink k_coord.
Standardize a minimal replication checklist in your packet to reduce back-and-forth and cut k_coord.
The other hidden coordination tax comes from bad categorization. If your ticket tags are inconsistent, you can't compute presolvehere per category, because you don't have clean categories to measure. Getting your ticket taxonomy clean with real naming and ownership rules is a prerequisite for this whole model — the thresholds only work if you can trust the category each ticket lands in.
A real scenario
Business type: A roughly 14-person support team at a mid-market payroll software company.
The problem: Escalations to their payroll-engineering team had crept up to around 22% of all tickets. Engineering was complaining that most escalations were things tier 1 "should have handled," while tier 1 insisted they were doing the safe thing. Nobody had numbers, so it stayed a vibes argument.
They spent about two weeks tagging escalations by category and estimating presolvehere per category from historical resolution data. What surfaced was uncomfortable: three categories — password/access resets, report formatting questions, and basic tax-table lookups — accounted for over half of escalations and had a local resolve probability above 0.70 once a runbook existed. They were being escalated purely out of habit.
What they changed: Built runbooks for those three categories, set a threshold rule that tier 1 must attempt them locally first, and fast-pathed the genuinely hard categories (data-integrity, tax-calculation bugs) straight to engineering with a structured packet.
| Metric | Before | After |
|---|---|---|
| Escalation rate | ~22% | ~13% |
| Estimated blended escalation cost | ~$9,000 | ~$5,500 |
| Engineering interrupt volume | High | Noticeably reduced |
The interesting part: CSAT didn't drop. The worry going in was that keeping tickets at tier 1 would hurt customers. It didn't, because tier 1 could resolve those categories with a runbook — they'd just never been asked to try.
When this model is worth building
When it makes sense:
-
Your escalation rate is above ~15% and climbing
-
Engineering or tier 2 is complaining about "trivial" escalations
-
You have enough ticket history to estimate resolution rates per category
-
You have reasonably clean categorization to segment by
When it's a bad idea:
-
You're a 2–3 person team where everyone touches everything. The overhead of modeling exceeds the savings; just talk to each other.
-
Your ticket volume is so low that per-category probabilities are statistical noise. You need at least a few dozen tickets per category to trust the numbers.
-
Your categorization is a mess. Fix that first — a model built on garbage categories produces confident wrong answers, which is worse than no model.
Who should skip it entirely: Early-stage teams still figuring out what their common issues even are. Model the escalation economics after you have stable categories and a baseline, not before.
How to actually run this
Here's the minimal process to get from "we escalate too much" to defensible thresholds:
-
Pull 60–90 days of escalated tickets and tag them by category.
-
For your top 6–8 categories, estimate presolvehere from historical outcomes — how often did tier 1 resolve it before escalating, or how often did the escalation turn out to be something tier 1 could have done?
-
Estimate the four cost pieces (handling, coordination, wait penalty, failure cost) per category. Approximate is fine.
-
Compute resolve-here vs escalate cost for each category.
-
Set threshold rules using the three-band logic above.
-
Identify the "murky middle" categories and invest in runbooks and search to push their resolve probability up, rather than trying to route your way around them.
-
Re-check quarterly. Resolution probabilities drift as your product and team change.
A quick checklist before you trust your thresholds:
-
[ ] Categories are clean and consistently applied
-
[ ] Each category has enough volume to be statistically meaningful
-
[ ] You've included opportunity cost, not just direct labor
-
[ ] Wait penalty reflects actual customer sensitivity, not a flat guess
-
[ ] Failure/double-payment cost is accounted for on local attempts
-
[ ] Someone owns each threshold rule and reviews it quarterly
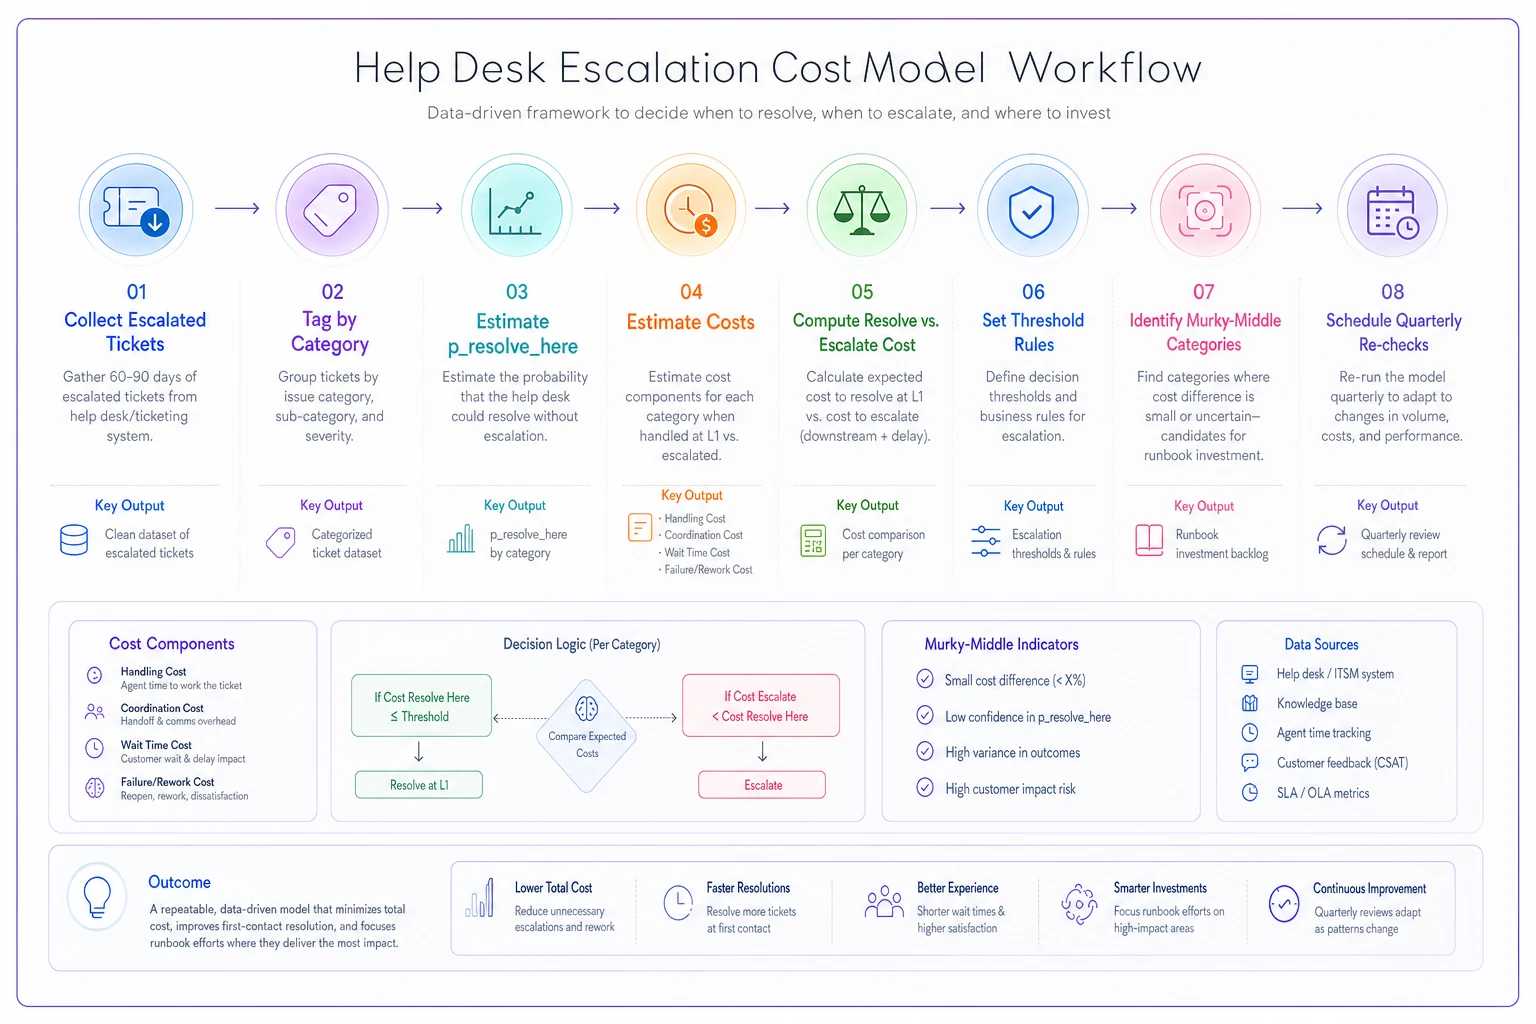
Use the diagram as a one-page reference for the process steps and ownership.
Running through this checklist before locking in thresholds has saved teams from building a model that looks rigorous but is quietly running on bad inputs. The math is only as trustworthy as the categories underneath it.
Escalation costs stay invisible because they're spread across teams that don't share a budget line. Tier 1 escalates, engineering absorbs it, and no single person ever sees the full price. The model above doesn't need to be precise — even rough numbers shift the conversation from "did we do the safe thing" to "did we do the economical thing," which are frequently not the same decision.
Run the math on your top handful of escalation categories. You'll almost certainly find one or two being escalated out of pure habit, and one or two that should be fast-pathed but aren't. Fixing just those is usually worth more than any broad policy change — and unlike a policy change, you'll have the numbers to defend it.
Ready to transform your support operations?
Join 500+ support teams using Servyly to reduce resolution times, improve customer satisfaction, and boost team productivity.